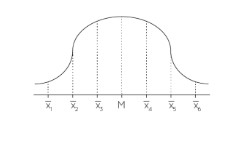
The central limit theorem is a fundamental concept in statistics and probability theory. It states that, given a sufficiently large sample size from any population with a finite mean and variance, the distribution of the sample means will approach a normal distribution. In other words, the sum of independent, identically distributed random variables will tend to be normally distributed, regardless of the shape of the original distribution.
Introduction to the Central Limit Theorem
The Central Limit Theorem (CLT) is a powerful tool that helps us understand the behavior of various random variables and make predictions based on data. It is one of the most important theorems in the field of statistics and probability theory.
Statement of the Central Limit Theorem
The Central Limit Theorem states that, given a large enough sample size, the distribution of the mean of the sample values will approximate a normal distribution, regardless of the shape of the original distribution of the population from which the sample is taken.
This means that even if the original population distribution is not normal, the distribution of the sample means will converge to a normal distribution as the sample size increases. This property of the sample means is crucial for many statistical analyses and applications, such as hypothesis testing and confidence interval estimation.
The central limit theorem is a powerful concept that allows us to make reliable inferences and predictions based on sample data, even when the underlying population distribution is unknown or complex. By understanding and applying the central limit theorem, researchers and analysts can draw meaningful conclusions from their data and make informed decisions.
The formula of Central Limit Theorem
The Central Limit Theorem can be mathematically expressed as follows:
Let X1, X2, X3, ..., Xn be a random sample of size n from a population with mean μ and standard deviation σ. Then, the distribution of the sample mean X approaches a normal distribution with mean μ and standard deviation n as n approaches infinity.
Central Limit Theorem for Sample Means, Z= x-n

Proof of Central Limit Theorem
The proof of the Central Limit Theorem is based on the idea of the law of large numbers, which states that the average of a large number of independent and identically distributed random variables will approach the expected value. CLT uses this idea to prove that the sum of many independent and identically distributed random variables will approach a normal distribution.
Consider x1,x2,x3,……,xn are independent and identically distributed with mean and finite variance 2, then any random variable Zn as,
Zn=X-n-n
Here,
xn=1ni=1nxi
Then, as n rises without bound, the Zn distribution function converges to the normal standard distribution function.
Again, define a random variable Ui by
which is a standard normal random variable's moment generating function.
Assumptionsof Central Limit Theorem
- The Central Limit Theorem assumes a properly distributed underlying population.
- The sample size is sufficiently large (typically n >= 30) such that the distribution of the sample mean can be approximated as normal.
- The samples have to be equally and independently dispersed.
Uses of Central Limit Theorem
Hypothesis testing: CLT helps in hypothesis testing by providing a theoretical basis for estimating the probability of observing a sample mean that is different from the population mean.
Estimating population parameters: CLT can be used to estimate the population mean and standard deviation based on a sample.
Predictive modeling: CLT plays an important role in predictive modeling by providing a framework for making predictions based on the sample data.
Conclusion
The Central Limit Theorem is a fundamental theorem in the field of statistics and probability theory that states that the sum of many independent and identically distributed random variables approaches a normal distribution. CLT has many important applications in hypothesis testing, estimating population parameters, and predictive modeling.
Frequently Asked Questions
The Central Limit Theorem is a theorem in probability theory that states that the sum of many independent and identically distributed random variables approaches a normal distribution.
The Central Limit Theorem is a statistical theorem that states that the distribution of the sample mean will approach a normal distribution as the sample size increases, regardless of the shape of the population distribution.
The Central Limit Theorem is important because it allows us to make inferences about a population based on a sample of data. By using the sample mean, we can make predictions about the population mean and estimate parameters like the standard deviation and confidence intervals.
You can use the Central Limit Theorem when you have a sample of data and you want to make inferences about the population mean. However, it is important to ensure that the sample size is large enough and that the samples are independent and identically distributed (i.i.d.).
As the sample size increases, the distribution of the sample mean approaches a normal distribution. This means that larger sample sizes provide more accurate estimates of the population mean.