Download Free PDF Data Handling Worksheet for CBSE (NCERT) Class 4 Maths important questions with Answers
Q1 How many runs did Sachin Tendulkar score in the tournament?
(A) 340
(B) 380
(C) 400
(D) 0
Answer
A
Q.2 How many centuries did Sachin Tendulkar make in the tournament?
(A) 1
(B) 2
(C) 0
(D) 3
Answer
C
Q.3 How many half-centuries did Sachin Tendulkar make in the tournament?
(A) 1
(B) 2
(C) 4
(D) 3
Answer
C
Q.4 What was Sachin Tendulkar's highest score in the tournament?
(A) 80
(B) 100
(C) 120
(D) 140
Answer
A
Q.5 How many runs did Sachin Tendulkar score in the second match?
(A) 60
(B) 80
(C) 100
(D) 120
Answer
A
Q.6 Direction for questions: Students of different classes in a school took part in the fancy dress competition. The following bar graph tells us how many students participated in each class.
Answer the following questions.

From which class did the most students take part?
(A) Class-4
(B) Class-1
(C) Class-5
(D) Class-3
Answer
C
Q.7 Direction for questions: Students of different classes in a school took part in the fancy dress competition. The following bar graph tells us how many students participated from each class.
Answer the following questions.

From which class did 7 students take part?
(A) Class-3
(B) Class-4
(C) Class-1
(D) Class-2
Answer
B
Q.8 Direction for questions: Students of different classes in a school took part in the fancy dress competition. The following bar graph tells us how many students participated from each class.
Answer the following questions.

How many students from class-5 took part?
(A) 8
(B) 9
(C) 2
(D) 7
Answer
B
Q.9 Direction for questions: Students of different classes in a school took part in the fancy dress competition. The following bar graph tells us how many students participated from each class.
Answer the following questions.
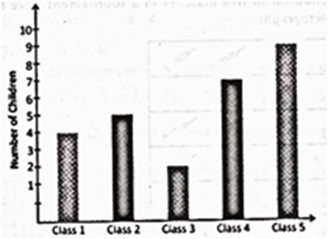
From which class did the least number of students take part?
(A) Class-2
(B) Class-4
(C) Class-3
(D) Class-1
Answer
C
Q.10 Direction for questions: Students of different classes in a school took part in the fancy dress competition. The following bar graph tells us how many students participated from each class. Answer the following questions.

Students from class-2 who participated in the competition were how many more than the class-1?
(A) 2
(B) 1
(C) 3
(D) 4
Answer
B
Q.11 Codi has a collection of old coins which has been shown in the following table.
| Coins | Numbers |
| Gold | 150 |
| Silver | 100 |
| Copper | 100 |
| Aluminium | 200 |
| Bronze | 150 |
Q.12 Which one of the following options represents the correct bar graph for the above collection?
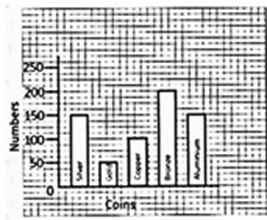
(A)
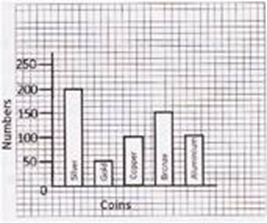
(B)
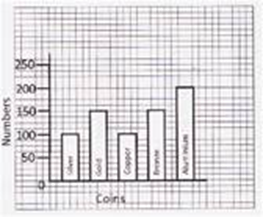
(C)
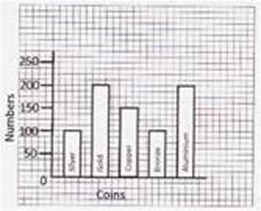
(D)
Answer
C
Q.13 Direction for questions: Shyam made a pictograph representing the number of trees planted in a city in 4 years from 2005 to 2008. Answer the following questions based on it.
One  represents 1000 trees
2005 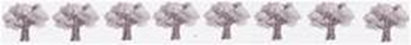
2006
2007
2008
In which year were the minimum number of trees planted?
(A) 2006
(B) 2005
(C) 2007
(D) 2008
Answer
B
Q.14 Direction for questions: Shyam made a pictograph representing the number of trees planted in a city in 4 years from 2005 to 2008. Answer the following questions based on it.
One  represents 1000 trees
2005
2006
2007
2008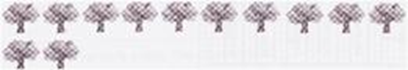
How many more trees were planted in 2008 than in 2005?
(A) 3000
(B) 5000
(C) 4000
(D) 6000
Answer
C
Q.16 Direction for questions: Shyam made a pictograph representing the number of trees planted in a city in 4 years from 2005 to 2008. Answer the following questions based on it.
One  represents 1000 trees
2005
2006
2007
2008
How many trees were planted in 2005?
(A) 4000
(B) 5000
(C) 6000
(D) 8000
Answer
D
Q.17 Direction for questions: Shyam made a pictograph representing the number of trees planted in a city in 4 years from 2005 to 2008. Answer the following questions based on it.
One represents 1000 trees
2005
2006
2007
2008
In which year were the maximum number of trees planted?
(A) 2006
(B) 2008
(C) 2007
(D) 2005
Answer
B
Q.18 Direction: In the following bar graph, marks obtained by Steve in different subjects has been shown:
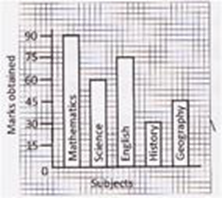
Read the above bar graph and answer the following questions
Find the difference between the highest marks and the lowest marks obtained by Steve in different subjects.
(A) 30
(B) 45
(C) 60
(D) 90
Answer
C
Q.19 Direction: In the following bar graph, marks obtained by Steve in different subjects has been shown:
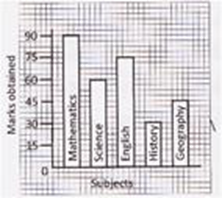
Read the above bar graph and answer the following questions
How much marks did Steve get in history?
(A) 30
(B) 45
(C) 60
(D) 90
Answer
A
Q.20 Questions are based on the following pictograph:
| Days | Number of transistor sold by a shop |
| Monday | 36 |
| Tuesday | 48 |
| Wednesday | 60 |
| Thursday | 24 |
| Friday | 48 |
| Saturday | 12 |
Jack makes a pictograph using the above data
| Monday |  |
| Tuesday |  |
| Wednesday | ? |
| Thursday |  |
| Friday |  |
| Saturday |  |
How many transistors does  represents?
(A) 4
(B) 8
(C) 12
(D) 16
Answer
C
Area, Perimeter and Volume