Extra Questions Based on chapter-3 Data Handling
This page consists of questions based on chapter-3 Data Handling of class 7 Maths and has MCQ-based questions with detailed explanations. to check out the solution of any MCQ click on the Answer. do solve NCERT textbook questions with the help of NCERT solutions for class 7 Maths.
Questions for chapter-3 Data Handling Set-1
Q1. The runs scored in a cricket match by 10 players is as follows.
13, 5, 22, 28, 42, 45, 50, 80, 45, 60
The mean of this data is
(a) 45 (b) 36
(c) 42 (d) 39
Ans.1. (d) The mean 
Q2. The median of the data
18,24,42,47, 49, 18,25,35,22 is
(a) 25 (b) 24
(c) 35 (d) 22
Ans.2. (a) Arrange the data is ascending or descending order; we get,
18, 18, 22,24,25,35,42,47,49
Median is the middle term observation,
Therefore, the median is 25
Q3. The mode of the following data
11,12,14,16,15,13,14,19,15,16,16,15,18,15,14,17,16,15,15,14,11,13,14,15,17,14,15,13,14
(a) 15 (b) 14
(c) 13 (d) 12
Ans.3. (a) Since, 15 has the highest number of times. Therefore, the mode of the data is 15.
Q4. The ages in years of 12 students of a class are, 27,32,35,28,42,46,32,41,39,40,45,36
The age of the oldest students is
(a) 45 years (b) 42 years
(c) 27 years (d) 46 years
Ans.4. (d) Arrange the given ages in ascending order 27, 28, 32, 32, 35,36,39,40,41,42,45,46, we find that the age of the oldest students is 46 years.
Q5. The runs scored in eight innings are 58, 75,40,36,47,46,0,98. The mean of the scores is,
(a) 48 (b) 50
(c) 47 (d) 60
Ans.5. (b) Mean of the scores 
Q6. The total scores in mathematics (out of 20) of 12 students is as follow;
18,25,22,20,9,20,15,10,5,16,25,20. The mode of this data is
(a) 25 (b) 20
(c) 22 (d) 15
Ans.6. (b) In the given data, 20 has occurred the highest number of times. Hence the mode of data is 20.
Q7. The weight (in kg) of 14 boys of the class are:
35,38,37,42,48,38,37,43,35,47,35,46,45,37
Is there more than one mode?
(a) Yes (b) No
(c) Cannot determine (d) None of these
Ans.7. (b) Since in the given data 35 and 37 occurred same number of times. So, the both are mode of data.
Q8. The median of the data:
19,17,14,13,12,11,18,10,7,9,11 is
(a) 11 (b) 12
(c) 14 (d) 13
Ans.8. (b) Arrange the following data in ascending order 7,9,10,11, 11,12,13,14,17,18,19
Hence, the middle term of given data 12 is the median.
Q9. Mean of 10 items was found to be 15. On verification, it was found that an item 21 was miscopied as 12. The correct mean is
(a) 15.9 (b) 14.1
(c) 24 (d) None of these
Ans.9. (a) Observed sum of the items = A × N
= 10 × 15 = 150
The corrected sum of the items
= 150 – 12 + 21 = 159
Corrected mean =159/10=15.9
Q10. Mode of the data 3, 2,5, 2, 3, 5, 6, 6, 5, 3, 5, 2, 5 is
(a) 6 (b) 4
(c) 5 (d) 3
Ans.10. (c) Since 5 is repeated maximum number of times, therefore, mode of the given data is 5.
Questions for chapter-3 Data Handling Set-2
Q11. The median of 10, 14, 11, 9, 8, 12, 6 is
(a) 10 (b) 12
(c) 14 (d) 11
Ans.11. (a) Arranging the given items in ascending order we get
6, 8, 9, 10, 11, 12, 14. These are 7 ( an odd number) observations, therefore, the median is 7+1/2 th i.e. 4th item which is equal to 10.
Q12. The median of the following data is 11, 29, 17, 21, 13, 31, 39, 19.
(a) 21+13/12 (b) 19
(c) 21 (d) 20
Ans.12. (b) Arranging the given data in ascending order of magnitude ;
11, 13, 17, 19, 21, 29, 31, 39
Here, the number of observations is 8, which is an even number
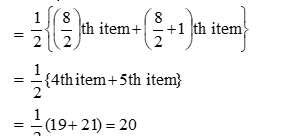
Hence, the median of the data
Q13. Two hundred students of 7th and 8th class asked to name their favourite colour so as to decide upon what should be the colour of their school building. The results are shown in the following bar graph.
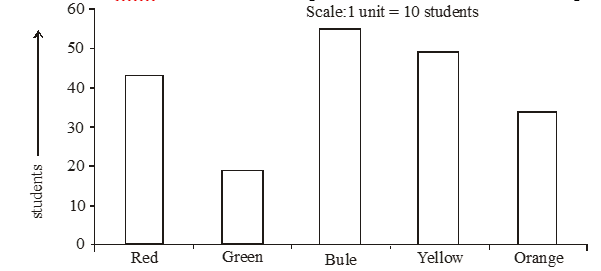
The most preferred colour is
(a) Blue (b) Green
(c) Red (d) Yellow
Ans.13 (a) Blue is the most preferred colour (Because the bar representing Blue is the tallest).
Directions:(Qs. 14-15): On the basis of following data give answers the following questions
The rainfall (in mm) in a city on 7 days of a certain week was recorded as follows.

Q14. The mean rainfall for the week is
(a) 5.64 mm (b) 6.64 mm
(c) 6.18 mm (d) 4.54 mm
Ans.14. (b) Mean rainfall 
Q15. On how many days was the rainfall less than the mean rainfall ?
(a) 2 (b) 3
(c) 5 (d) 5
Ans.15. (b) Monday = 0.3 mm, Thursday = 2.9 mm, Friday = 4.5
Q16. What is probability of getting 3 on a dice?
(a) 1/3 (b) 1/2
(c) 1/6 (d) 1/5
Ans.16. (c) = Probability=Favourable Trials / Total No of Trials = 1 / 6
Q17. There are 30 cards which are numbered from 1 to 30? You have to select a card. What is the probability of getting a card having prime number?
(a) 1/2 (b) 1/3
(c) 13/30 (d) 11/30
Ans.17. (b) Prime numbers from 1 to 30 are
2, 3, 5,11,13,17,19,23,29
i.e. 10 prime numbers from 1 to 30
Probability=10/30 = 1/3
Q18. When a coin in thrown, then the probability of getting Head is
(a) 2 (b) 1/2
(c) 1 (d) 1/4
Ans.18. (b) When a coin is thrown, it has two possible outcomes i.e Head or Tail,
Therefore, required probability = 1/2
Q19. When a dice is thrown, then the probability of getting an even number on dice, is
(a) 1/3 (b) 1/2
(c) 1/5 (d) 1/6
Ans.19. (b) If a dice is thrown, it has six possible outcomes i.e. 1, 2,3,4,5 or 6.
Here 2, 4 and 6 are even numbers
Therefore, the required probability = 3/6 = 1/2
Q20. The median of the numbers, 2,2,2,3,3,4,5,5,5,6,6,8,9,7,7 is
(a) 2 (b) 3
(c) 5 (d) 9
Ans.20. (c) Arrange the data is ascending order is, 2,2,2,3,3,4,5,5,5,6,6,7,7,8,9
The median is the middle term of data therefore, the median is 5.
Q21. The mean of the first 9 whole numbers is,
(a) 3 (b) 2
(c) 4 (d) 6
Ans.21. (c) The mean of first 9 whole numbers is 
Q22. The marks obtained by a group of students in a science test are
76, 85, 90, 72, 89, 95, 56, 48, and 75
then the range of the marks obtained is
(a) 45 (b) 48
(c) 52 (d) 47
Ans.22. (d) Arrange the scores in ascending order, we have 48, 56, 72, 75, 76, 80, 85, 89, 90, 95
The range of the marks = (95 –48) = 47
Q23. There are 5 marbles in a box with numbers from 1 to 5 marks on each of them, then the probability of drawing a marble with number 5 is
(a) 1/2 (b) 1/4
(c) 1/5 (d) 1
Ans.23. (c) The probability of drawing a marble with number 5 (on any number ) = 1/5
Q24. Following data gives runs made by the particular players
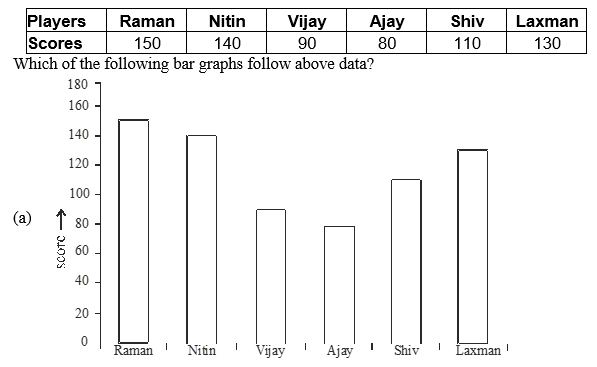

Ans.24. (a) Graph in option (a) follow all conditions of given data.
Q25. What is the probability of getting an ace from a well shuffled pack of cards?
(a) 1/13 (b) 2/13
(c) 1/52 (d) 1/26
Ans.25. (a) There are 4 aces out of 52 cards in a well shuffled pack of cards.
So, probability of getting an ace = 4/52 = 1/13
Questions for chapter-3 Data Handling Set-3
Q1. The mean of the first five whole numbers is
(a) 3 (b) 2
(c) 4 (d) 5
Ans.1. (b) First five whole number are 0, 1, 2, 3, 4
Then mean of first five number= 0+1+ 2+ 3+ 4 / 5 =10/5 =2
Q2. The mean of first six natural number is
(a) 3.5 (b) 4.5
(c) 2.5 (d) 5.5
Ans.2. (a) First five natural number are 1, 2, 3, 4, 5, 6.
Then mean =1+ 2+ 3+ 4 + 5 + 6 / 6 = 21/6 =7/2 = 3.5
Q3. The mean of first five prime number is
(a) 5.7 (b) 5.6
(c) 5.8 (d) 5.9
Ans.3. (b) First five prime number are 2, 3, 5, 7, 11.
Mean = (sum of all observation)/total observation
Mean = 2+ 3 + 5 + 7 + 11 / 5 = 28/5 = 5.6
Q4. A cricketer scores the following runs in seven innings:
56, 46, 76, 3, 100, 49, 62,
the mean score is ……
(a) 65 (b) 66
(c) 56 (d) 58
Ans.4. (c) Mean = (sum of all observations)/number of observations
Mean = 56+ 46 + 76 + 3 + 100 + 49 + 62 / 7 = 392/7 = 56
Q5. The rainfall (in mm) in a city on 7 days of a certain week was recorded
as follows:
Day
Mon- Tue -Wed- Thurs- Fri- Sat- Sun
Rainfall (in mm)
0.0- 12.2- 2.4- 0.8- 20.1- 5.4- 2.0
Find the range of the rainfall in the above data.
(a) 19.2 (b) 20.1
(c) 20.0 (d) 19.3
Ans.5. (b) Range = highest observation - lowest observation
= 20.1 -0.0 = 20.1 mm
Q6. The heights of 10 girls were measured in cm and the results are as follows:
135, 150, 139, 128, 151, 146, 132, 149, 143, 141
what is the mean height of the girls?
(a) 151.4 (b) 161.4
(c) 131.4 (d) 141.4
Ans.6. (d) Mean = sum of all observation / number of all observation
Mean =135+ 150 + 139 + 128 + 151 + 146 + 132 + 149 + 143 +141 / 10 = 1414 / 10 = 141.4
Q7. The mode of the given set of numbers: 5, 5, 3, 2, 5, 3, 4, 2, 3, 5
(a) 2 (b) 3
(c) 4 (d) 5
Ans.7. (d) Arranging the numbers with same value together, we get
2, 2, 3, 3, 3, 4, 5, 5, 5, 5
Mode of this data is 5 because it occurs more frequently than other
observations.
Q8. The mode of the given data 2, 6, 5, 3, 0, 3, 4, 3, 2, 4, 5, 2, 4 is
(a) 3 and 4 (b) 3,4 and 5
(c) 2,3 and 4 (d) 0 and 6
Ans.8. (c) Arranging the numbers with same value together, we get
0, 2, 2, 2, 3, 3, 3, 4, 4, 4, 5, 5, 6.
Here 2, 3 and 4 occur three times.
So 2, 3 and 4 are the mode of the given data.
Q9. The median of the given data 9, 12, 15, 16, 13, 13, 19, 18, 14, 20, 12 is
(a) 13 (b) 14
(c) 12 (d) 15
Ans.9. (b) Arranging the given data in ascending order.
9, 12, 12, 13, 13, 14, 15, 16, 18, 19, 20
Median is the middle observationin given data.
Here, middle observation is 14.
Q10. Which statement is false in the following statement?
(a) The data 1, 2, 1, 1, 2, 1, 3, 4, has mode 1.
(b) The data 4, 6, 6, 4, has mean 5.
(c) The median is always one in a data.
(d) Mean = number of observation / sum of all observation
Ans.10. (d) Mean = sum of all observation / number of observation
Q11. The marks (out of 100) obtained by a group of students in an English
test are 65, 64, 56, 79, 77, 54, 49, 80, 89 and 75. What is the range of
the marks obtained?
(a) 35 (b) 40
(c) 33 (d) 25
Ans.11. (b) Range = highest marks - lowest marks
= 89 - 49 = 40
Q12. The weights (in kg.) of 12 students of a class are:
35, 42, 35, 37, 45, 51, 32, 42, 32, 40, 45, and 51.
How many modes in the given data?
(a) 2 (b) 3
(c) 4 (d) 1
Ans.12. (c) Arranging the given data in ascending order.
32, 32, 35, 35, 37, 40, 42, 42, 45, 45, 51 and 51.
Here 32, 35, 42, 45 and 51 all occure two times.
Hence, the given data has 5 modes.
Q13. sale of English and Hindi books in the year 1995, 1996, 1997, and 1998
are given below:

In which year was the difference in the sale of the two language books
least?`
(a) 1995 (b) 1996
(c) 1997 (d) 1998
Ans.13. (c) In 1995, difference between language books = 500 - 350 = 150
In 1996, difference between language books = 425 - 300 = 125
In 1997, difference between language books = 845 - 785 = 60
In 1995, difference between language books = 640 - 570 = 70
Q14. Read the bar graph and answer the following question:
In which year were 200 books sold?
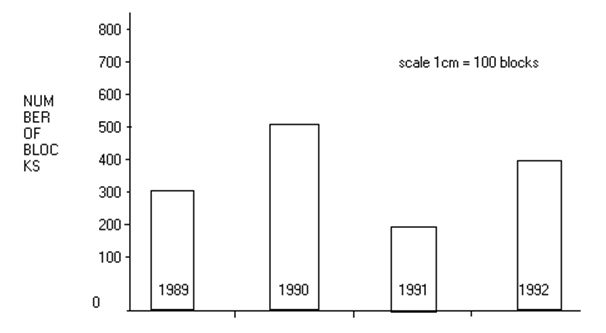
(a) 1989 (b) 1991
(c) 1992 (d) 1990
Ans.14. (b) In the bar graph 200 books were sold in 1991.
Q15. Number of children in six different classes are given below.
Answer the following the questions:

(a) 4:5 (b) 5:4
(c) 4:3 (d) 3:4
Ans.15. (b) Ratio of students of class fifth to the student of class ninth = 125/100
= 5/4 =5:4
Q16. There are six marbles in a box with with numbers from 1 to 6 marked
on each of them. What is the probability of drawing a marble with
number 3?
(a) 1/2 (b) 1/3
(c) 1/4 (d) 1/6
Ans.16. (d) Probability = favourable trials / total no. of trials
Probability = 1 / 6
Q17. When a coin is thrown, then what is the probability of getting tail?
(a) 1/3 (b) 1/2
(b) 1/4 (d) 1/5
Ans.17. (b) When a coin is thrown, it has two possible outcomes, head or tail.
Here, favourable trials = 1
Total number of trails = 2
probability = favourable trials/total number of trails
probability = 1 / 2
Q18. Following data gives total marks (out of 600) obtained by five children
of a particular class.

Answer the following question:
which students get equal marks?
(a) Amit and Arjun (b) Shashank and Ruchi
(c) Amit and Ritu (d) Shashank and Ritu
Ans.18. (c) In the given data amit and ruchi have equl marks.
Q19. Mode of the data 23, 24, 23, 21, 25, 25, 23, 21, 23, is …..
(a) 21 (b) 23
(c) 25 (d) 24
Ans.19. (b) Arranging the given data in ascending order. We have
21, 21, 23, 23, 23, 23, 24, 25, 25
Here, 23 occure four times.
Then, mode of the given data is 23.
Q20. The scores in mathematics test (out of 25) of 15 students are as follow:
19, 16, 15, 24, 25, 23, 19, 20, 19, 6, 21, 22, 10, 19, 9,
the median of the given the data is
(a) 15 (b) 20
(c) 25 (d) 19
Ans.20. (d) Arranging the given data in ascending order. We have
6, 9, 10, 15, 16, 19, 19, 19, 19, 20, 21, 22, 23, 24, 25
Median is the middle observation of the given data.
So, here middle observation is 19.
Q21. Probability always lying between in ………….
(a) 1 to 2 (b) 2 to 3
(c) 0 to 1 (d) none of them
Ans.21. (c) Probability always lying between in 0 to 1
Q22. When a die was thrown, then what will be the probability of getting 3?
(a) 1/2 (b) 1/3
(c) 1/4 (d) 1/6
Ans.22. (d) When a die is thrown, it has six possible outcomes, 1, 2, 3, 4, 5, and 6.
Probability = favourable trials/total number of trails
probability = 1/6
Q23. Median of the first ten whole number is
(a) 4 (b) 5
(c) 6 (d) 7
Ans.23. (b) First ten whole numbers are 0, 1, 2, 3, 4, 5, 6, 7, 8, 9, 10.
Median is the middle observation of the given data.
Here, middle observation = 5
Q24. Range of the data 13, 24, 23, 31, 5, 25, 2, 21, 23, is …..
(a) 29 (b) 27
(c) 26 (d) 18
Ans.24. (a) Range = highest value - lowest value
Range = 31 - 2 = 29
Q25. The weights (in kg) of 11 students of a class are:
38, 45, 41, 32, 37, 35, 38, 40, 36, 46, and 39
what is the median of the given data?
(a) 38 (b) 39
(c) 37 (d) 40
Ans.25. (a) Arrange the given data in ascending order. We have
32, 35, 36, 37, 38, 38, 39, 40, 41, 45, 46
The Median is the middle observation of the given data.
Here, 38
Mathematics
Class VII
Chapter - 3
Data Handling
[1 Mark for Each Question]
Q 1: The arithmetic mean of the numbers 2, 9, 3 and 6 is
(a) 4.
(b) 5.
(c) 6.
(d) 7.
Ans: (b)
Explanation:
Airthmetic Mean = 2+9+3+6 / 4 = 20/4 = 5
Q 2: The arithmetic mean of the numbers 5, 3, 8, 9, 7 and 4 is
(a) 10.
(b) 8.
(c) 6.
(d) 5.
Ans: (c)
Explanation:
Airthmetic Mean = 5+3+8+9+7+4 / 6 = 36/6 = 6
Q 3: The arithmetic mean of the numbers 4, 9, 3, 2, x, 5 and 1 is 4. The value of x is
(a) 4.
(b) 5.
(c) 6.
(d) 7.
Ans: (a)
Explanation:
Airthmetic Mean = 4+9+3+2+x+5+1 / 7⇒ 4 = 24+x / 7⇒ 28 = 24+x ⇒ x=4
Q 4: The heights of ten students of a class are 130, 138, 140, 142, 130, 129, 131, 139, 135 and 133 (in cm). The mean height is
(a) 133 cm.
(b) 133.5 cm.
(c) 134 cm.
(d) 134.7 cm.
Ans: (d)
Explanation:
Mean Height = 130+138+140+142+130+129+131+139+135+133 cm /10 = 1347/10 cm = 134.7 cm
Q 5: Marks obtained by 14 students in an examination (out of 40) are 26, 39, 13, 40, 0, 37, 10, 36, 23, 21, 35, 18, 4 and 34. The mean of the marks is
(a) 20.
(b) 23.
(c) 24.
(d) 27.
Ans: (c)
Explanation:
Mean Marks = Sum Of Observation / No of Observation = 29+39+13+40+0+37+10+36+23+21+35+18+4+34/14 = 336/14 = 24
Q 6: The median of 9, 6, 41, 15 and 11 is
(a) 9.
(b) 11.
(c) 15.
(d) 41.
Ans: (b)
Explanation:
On arranging the number in ascending order, we get
6, 9, 11, 14, 15
Here, total number of observations = 5 (i.e., odd number)
Median = 11 (The number in the middle)
Q 7: The median of 7, 4, 34, 11, 5 and 17 is
(a) 7.
(b) 8.
(c) 9.
(d) 11.
Ans: (c)
Explanation:
On arranging the number in ascending order, we get
4, 5, 7, 11, 17, 34
Here, total number of observations = 6 (i.e., even number)
Now, add the two middle numbers and divide by 2, we have
(7 + 11)/2 = 9
Median = 9
Q 8: The mode of 7, 4, 4, 36, 13, 13, 36, 12, 12, 12, 26, 41, 12 and 8 is
(a) 4.
(b) 12.
(c) 13.
(d) 36.
Ans: (b)
Explanation:
On arranging the numbers in ascending order, we get
4, 4, 7, 8, 12, 12, 12, 12, 13, 13, 26, 36, 36, 41
Since, the number 12 occurs the most at 4 times, hence, mode = 12
Q 9: The number of times a particular observation occurs is called its
(a) frequency.
(b) data.
(c) statistics.
(d) average.
Ans: (a)
Explanation:
For example,
1, 1, 1, 2, 2, 2, 2, 2, 3, 4, 4, 5, 5, 6
Here maximum frequency of 2 = 5
Thus, we say that the number of times a particular observation occurs is called its frequency.
Q 10: The range of the given data 35, 36, 46, 50, 55 and 60 is
(a) 20.
(b) 22.
(c) 25.
(d) 26.
Ans: (c)
Explanation:
Range = largest value – smallest value
= 60 - 35 = 25
Q 11: Marks obtained by 8 students in a class assessment are 6, 9, 3, 4, 1, 7, 5 and 8. The range of the marks is
(a) 1.
(b) 3.
(c) 5.
(d) 8.
Ans: (d)
Explanation:
On arranging the data in ascending order, we get
1, 3, 4, 5, 6, 7, 8, 9
Range = largest value – smallest value
= 9 – 1 = 8
Q 12: The data 6, 4, 3, 8, 9, 12, 13 and 9 has mean
(a) 8.
(b) 6.
(c) 4.
(d) 3.
Ans: (a)
Explanation:
Mean = 6+4+3+8+9+12+13+9 / 8 = 64/8 = 8
Q 13: The probability of getting 3 on a dice will be
(a)1/2
(b)1/3
(c)1/5
(d)1/6
Ans:(d)
Explanation:
Since, Probabiltiy = Favourable Trials / Total No of Trials
Hence Probabilty of getting 3 on a dice = 1/6
Q 14: The probability of getting a king from a well-shuffled pack of cards will be
(a) .1/52
(b) 1/13.
(c) .1/4
(d) 4.
Ans:(b)
Explanation:
Since, there are 4 kings out of 52 cards in a well-shuffled pack of cards.
Therefore the probability of getting a king will be 4/52 = 1/13
Q 15: When a coin is thrown, then the probability of getting tail, is
(a) 2.
(b) 1.
(c) 1/2
(d) 1/4
Ans:(c)
Explanation:
When a coin is thrown, it has two possible outcomes i.e. Head or Tail.
Therefore the probability of getting Tail = 1/2
Q 16: When a dice is thrown, then the probability of getting an even number on dice, is
(a) 1/6
(b) 1/4
(c) 1/3
(d) 1/2
Ans:(d)
Explanation:
When a dice is thrown, it has six possible outcomes i.e. 1, 2, 3, 4, 5 or 6.
And, total even numbers are 3.
Therefore the probability of getting an even number on dice =3/6 = 1/2
Q 17: The probability of getting a diamond from a well-shuffled pack of cards will be
(a) 1/4
(b) 1/13
(c) 1/52
(d) 4.
Ans:(a)
Explanation:
There are 13 diamonds out of 52 cards in a well-shuffled pack of cards.
Therefore the probability of getting a diamond card is 13/52 = 1/4
Q 18: When a dice is thrown, then the probability of getting prime numbers on dice, is
(a) 1/6
(b) 1/3
(c) 1/2
(d) 1.
Ans:(c)
Explanation:
When a dice is thrown, it has six possible outcomes i.e. 1, 2, 3, 4, 5 or 6.
And, prime numbers are 3, i.e., 2, 3 or 5.
Therefore the probability of getting an even number on dice =3/6 = 1/2
Q 19: The mean average of three numbers is 10. If two of them are 12 and 9, then the third number will be
(a) 6.
(b) 7.
(c) 8.
(d) 9.
Ans: (d)
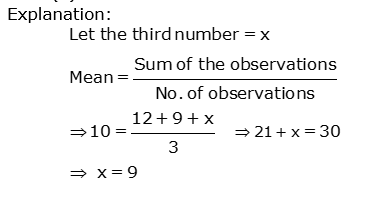
Q 20: Rajan took six-math test and got scores of 78, 84, 92, 84, 68 and 96 (out of 100). Rajan’s mode score was
(a) 78.
(b) 84.
(c) 92.
(d) 96.
Ans: (b)
Explanation:
On arranging the test scores in ascending order, we get
68, 78, 84, 84, 92, 96
Since, the number 84 occurs the most at 2 times, hence, mode = 84
Q 21: The temperature in degree Celsius over five days in June 2008 was 22, 18, 20, 22 and 23. The mean temperature was
(a) 23.
(b) 22.
(c) 21.
(d) 20.
Ans: (c)
Explanation:
Let the third number = x
Mean = 22+18+20+22+23 / 5 =105/5 = 21
Q 22: The heights of six children are 131, 136, 132, 139, 134 and 135. The range of their height is
(a) 8.
(b) 7.
(c) 6.
(d) 5.
Ans: (a)
Explanation:
On arranging the heights in ascending order, we get
131, 132, 134, 135, 136, 139
Range = largest value – smallest value
= 139 - 131 = 8
Q 23: The cost of five biscuits is Rs12, Rs20, Rs15, Rs18 and Rs24. The median cost is
(a) Rs12.
(b) Rs18.
(c) Rs20.
(d) Rs24.
Ans: (b)
Explanation:
On arranging the price in ascending order, we get
Rs12, Rs15, Rs18, Rs20, Rs24
Here, total number of observations = 5 (i.e., odd number)
Median = Rs18 (The number in the middle)
Q 24: The weekly salaries of six employees at McDonalds are Rs600, Rs680, Rs740, Rs680, Rs 720 and Rs800. The mean salary is
(a) Rs600.
(b) Rs680.
(c) Rs690.
(d) Rs700.
Ans: (d)
Explanation:
Mean Salary of employees = Rs 600+680+740+680+700+800 / 6 = Rs 4200 / 6 = Rs 700
Q 25: The ages in years of eight employees are 32, 41, 28, 54, 35, 26, 33 and 38. The range of the ages of the teachers is
(a) 26.
(b) 28.
(c) 31.
(d) 33.
Ans: (b)
Explanation:
Arranging the ages in ascending order, we get
26, 28, 32, 33, 35, 38, 41, 54
Range = largest value – smallest value
= 54 - 26 = 28