Share
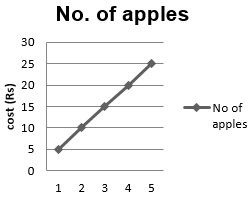
A. Cost of apples
Number of apples 1 2 3 4 5
Cost (in Rs) 5 10 15 20 25
B. Distance travelled by a car
Time (in hours) 6 a.m. 7 a.m. 8 a.m. 9 a.m.
Distances (in km) 40 80 120 160
(i) How much distance did the car cover during the period 7.30 a.m. to 8 a.m?
(ii) What was the time when the car had covered a distance of 100 km sinceit’s start?
C. Interest on deposits for a year.
Deposit (inRs) 1000 2000 3000 4000 5000
Simple Interest (in Rs) 80 160 240 320 400
(i) Does the graph pass through the origin?
(ii) Use the graph to find the interest on Rs 2500 for a year.
(iii) To get an interest of Rs 280 per year, how much money should bedeposited?
Question
(a) We will mark the number of apples on x-axis and cost of apples on y-axis.
The graph of the given data:
(b) We will represent time on x-axis and the distance travelled on y axis. The graph of the given data is:
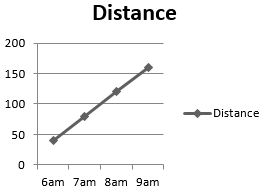
i. During the 7:30am-8am period, the car covered 20km
ii. The car covered a distance of 100km at 7:30am since its start.
(c) We can represent the deposit on x-axis and the interest earned on y-axis.
Hence, the required graph is:
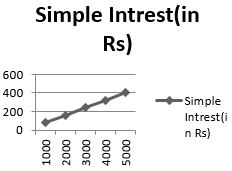
I. No,the graph pass through the origin
II. The mid-point between 2000 and 3000 is near Rs.200. Hence, the interest for Rs. 2500 is Rs.200.
III. To get an interest of Rs 280 per year, 3500 money should be deposited
solved
5
wordpress
4 mins ago
5 Answer
70 views
+22
Leave a reply